
CDN quotes advertise a per-gigabyte rate; CDN bills contain six line items. This worksheet builds a defensible total-cost estimate from your own traffic profile before any contract is signed — and runs the sensitivity checks that catch the surprises while they are still hypothetical.
Why the per-GB rate misleads
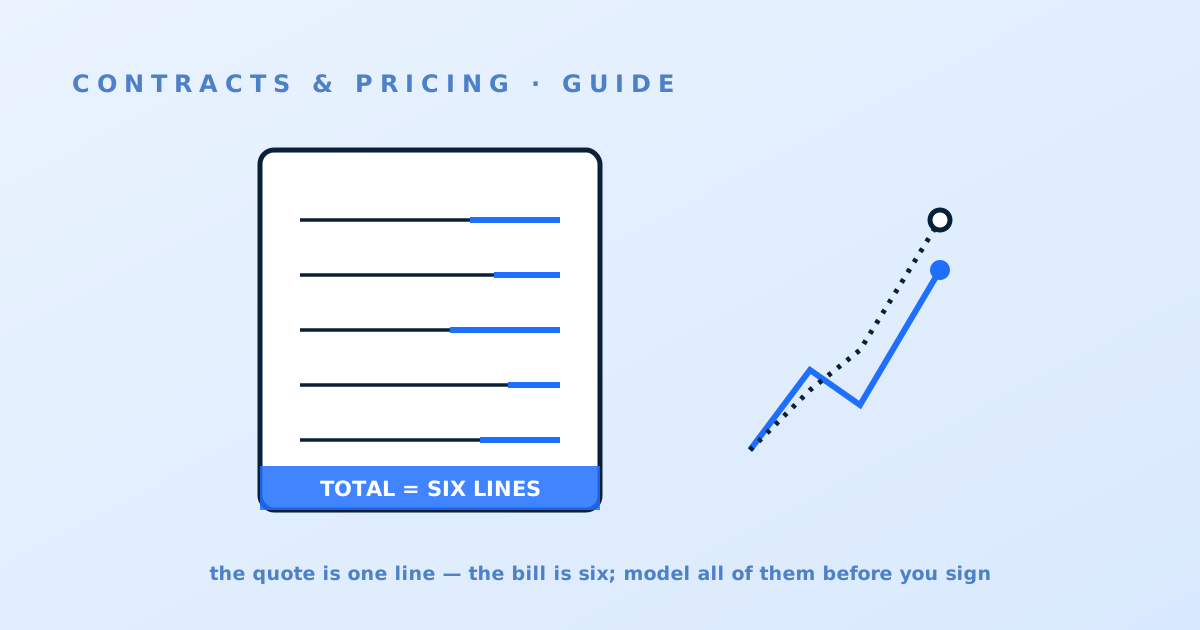
Delivered bandwidth is the headline number and, for many estates, no longer the majority of the bill. Requests are priced separately almost everywhere and dominate for small-object workloads; features carry their own meters (rules, WAF requests, image transformations, log delivery, shield fetches); origin-side costs (cloud egress on cache fills) sit on a different invoice entirely; and regional rate rows mean the same gigabyte costs different amounts in Mumbai and Frankfurt. A TCO estimate that models only GB × rate reliably lands 30–60% under reality for feature-rich estates. The worksheet exists to model the bill's actual shape.
Build your traffic inputs
Everything downstream depends on eight inputs, all extractable from origin logs or current-CDN reporting: monthly delivered GB; monthly requests (split HTML/API vs static if you can); average and P95 object size; cacheability split (what share can cache at all); expected cache-hit ratio (be pessimistic — model your current ratio, not the aspiration; measure it properly first); geography by rate region (each vendor's regions differ — map your countries to each candidate's rows); peak-to-average ratio; and monthly growth rate. Where you must guess, write the guess down as a guess — the sensitivity pass in section four exists to test exactly those cells.
The six line items
Model each explicitly. Bandwidth: delivered GB per rate region × that region's rate. Requests: total requests × per-10k or per-million pricing — check whether HTTPS and HTTP/3 requests price differently. Features: every add-on you intend to use, at its meter (rules count, WAF request pricing, transformations, real-time logs). Origin egress: (1 − hit ratio) × cacheable GB × your origin provider's egress rate — the line that zero-egress storage kills, per the bucket comparison. Support: the tier you will actually need, not the one bundled. Commit shape: if committing, the overage rate and the cost of under-consumption — a commit you miss by 30% raises your effective per-GB rate by more than most discounts lower it.
Model, then stress the model
With the six lines built per candidate, run three stresses. Hit-ratio sensitivity: recompute at −10 points of cache-hit ratio; if the total moves violently, your economics depend on cache behavior you have not yet proven, which reorders your evaluation priorities. Traffic-mix drift: double the request count at constant GB (the direction real products drift as pages get chattier); request-heavy pricing differences that looked trivial become decisive. The peak month: model your biggest expected month against the commit shape — this is where overage rates and burst clauses stop being fine print. Present each candidate as a range across these stresses, not a single number; a vendor cheapest at the midpoint and most expensive under stress is telling you something.
From estimate to negotiation anchor
The finished worksheet does three jobs. It ranks candidates on comparable totals instead of headline rates. It arms the negotiation — you can now price every proposed line against your own model and the reference bands in what a CDN should cost, and ask precise questions about the lines that diverge. And it becomes the bill-audit baseline: the first three invoices checked against the worksheet catch metering surprises while they are still correctable, and the renewal conversation starts from a model instead of a memory, per the renewal guide.