
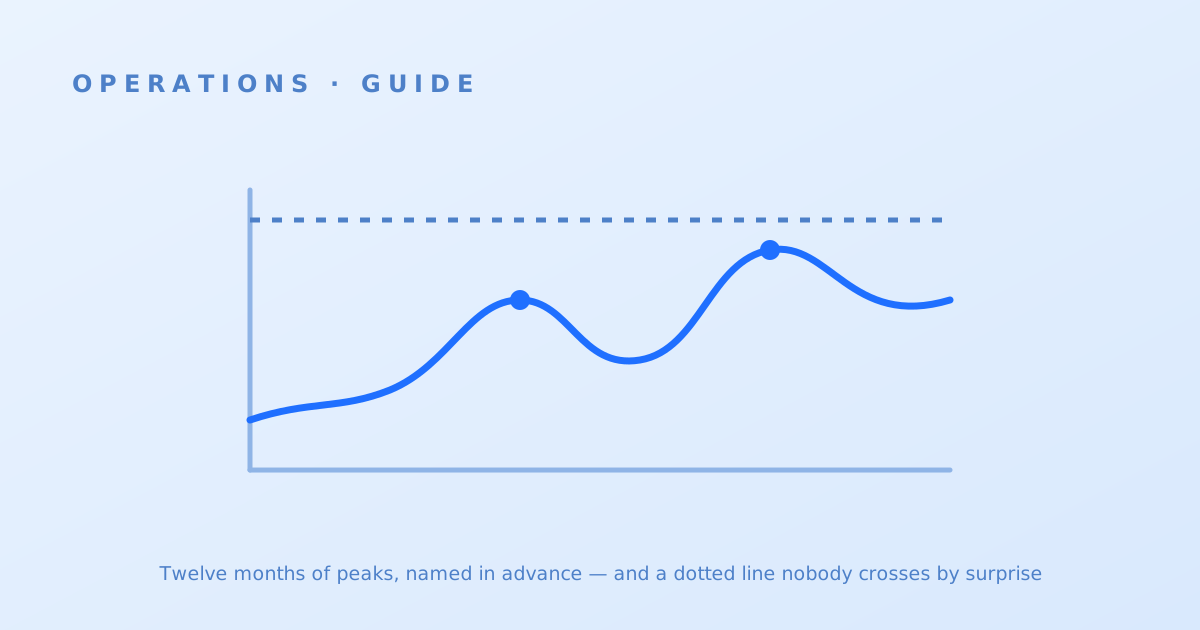
Renting the edge does not exempt you from capacity planning; it changes what the word means. The CDN’s job is having the terabits; your job is knowing your peaks before they arrive — because commits, provider notifications, origin sizing and budget all key off numbers that someone must write down twelve months early. The plan is one page: a baseline curve, an event layer, provider thresholds, and a headroom policy, reviewed quarterly.
What capacity means when you rent the edge
Four consumers make the plan worth writing. Providers: every serious CDN wants notice above certain traffic levels — contractual notification thresholds, event processes, per-customer ceilings that exist whether or not anyone mentioned them — and a provider notified early treats your peak as a project, not a surprise. Contracts: commit sizing consumes the year’s volume distribution; getting the peaks wrong is how overage happens. The origin: your origin’s capacity must track miss traffic at peak, which scales with the same curve — the sizing input for everything in origin-load planning. And the budget: the spend forecast is this plan priced; they share a skeleton and should share a review. None of these needs precision; all of them need the honest shape of the year.
The baseline: seasonality and growth, per region
Start from the traffic history the invoice reviews already accumulated: two years of monthly delivered volume and peak rates, decomposed into the seasonal shape (your business has one — retail’s Q4 wall, media’s summer, education’s term-time) and the growth trend riding it. Two refinements make it a capacity plan rather than a finance chart. Peaks, not averages: capacity cares about the peak hour of the peak day, so carry a peak-to-average ratio per season alongside the volumes — it is remarkably stable per business and turns monthly forecasts into peak-rate estimates. Regions, not globals: growth is never geographically uniform, provider capacity and pricing are regional, and a plan that says “+30% overall” while one region doubles has missed the part providers needed to hear — keep the per-region split at whatever granularity your invoice already prices.
The event layer: peaks with names and dates
On the baseline, place the year’s named peaks — the same calendar the forecast’s event method maintains, now carried to capacity numbers: launches and patch days (audience × payload, delivered mostly in hours), live events (concurrency × bitrate, the full worked math), sales moments, marketing pushes. Each event line carries its peak-rate estimate, its region concentration, and its confidence — and the calendar is owned jointly with product and marketing, refreshed monthly, because the events you learn about late are the entire failure mode this layer exists to prevent. The composite — baseline curve plus event spikes, per region — is the year’s demand picture, and its top three moments are the ones the rest of the plan revolves around.
Providers, thresholds and notifications
Now overlay the supply side. From each contract and each account team, establish: the notification thresholds (traffic levels or growth rates above which they want warning, and the formal event process for the big moments); any per-customer or per-region ceilings on your current terms; and — asked directly, annually — where their regional capacity is tight, because providers will tell a customer who asks before the customer discovers it in December. Then diarize the notifications the composite picture triggers: events over the threshold get filed on the provider’s process weeks ahead (the QBR’s forward-look block is the natural venue for the rolling version); step-changes in regional growth get flagged as they firm up. In multi-CDN estates, the same overlay informs the split strategy — peaks can be placed where capacity and commits welcome them, which is one of multi-CDN’s quieter dividends.
The headroom policy and the quarterly loop
Tie it together with a written headroom policy — the multiple of forecast peak you insist be comfortably available at each layer: edge (via provider confirmations for named events, per the event guide’s booking discipline), origin (sized to peak miss traffic times the policy multiple — and re-tested when the multiple or the peak moves), and the ancillary ceilings people forget until they hit them (DNS query rates, log pipeline throughput, purge API limits). A common shape: 2× on baseline peaks, more on low-confidence events — but the number matters less than its being written, agreed, and applied consistently. Then run the loop: quarterly, actuals against plan (the peak-to-average ratio drifting? a region outgrowing its line?), the event calendar refreshed, provider confirmations renewed for the next quarter’s names — folded into the same review rhythm as everything else, with the year’s full reconciliation landing in the annual review. Capacity planned this way is invisible, which is the entire success criterion: the year’s biggest day arrives, and nothing about it is a surprise to anyone — including the providers who were told in March.