
Time to first byte is the most-cited and worst-understood delivery metric. It is not "server speed": it is DNS plus connection setup plus TLS plus edge processing plus — sometimes — a full round trip to your origin, summed into one number and then argued about. Measured without decomposition it starts turf wars; decomposed, it hands each millisecond to the layer that owns it. This guide is the decomposition.
What's inside the number
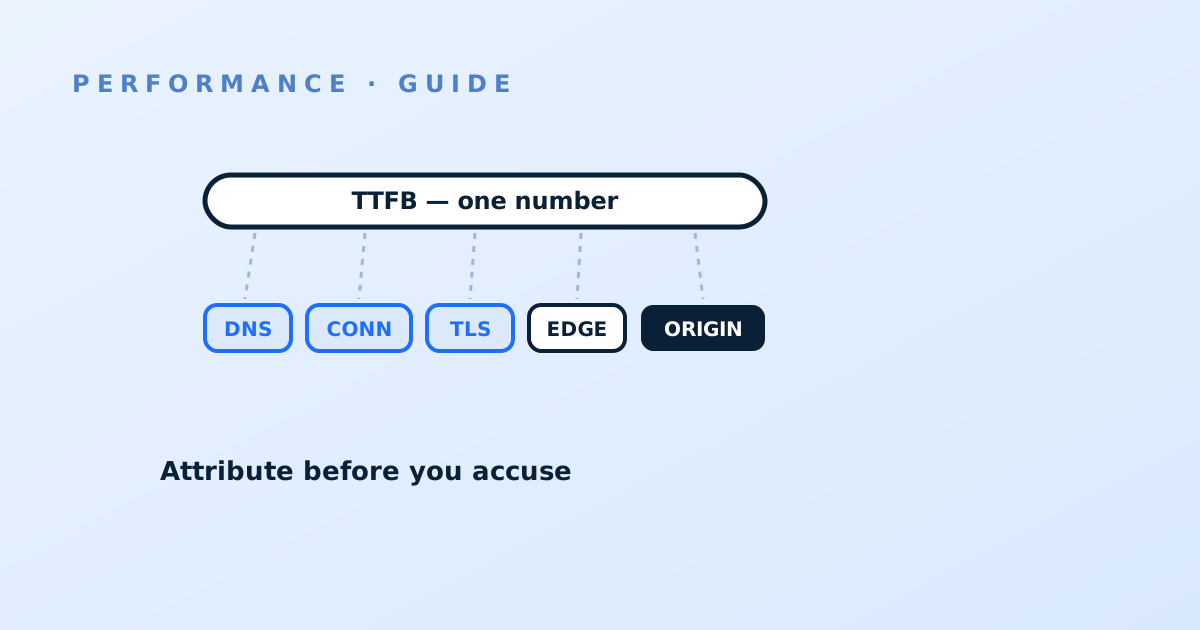
From the browser's perspective, first byte arrives after: a DNS resolution (possibly cached), a TCP or QUIC connection to the edge, a TLS handshake (possibly resumed), the edge deciding what to do with the request, and — on a cache miss — the whole edge-to-origin fetch including your application's think-time. A 600 ms TTFB can therefore be a slow origin, a cold connection from a distant user, an un-resumed handshake, or a low hit ratio sending too many requests to origin — four different problems with four different owners, indistinguishable in the aggregate. Rule one: never report TTFB without saying which segments and which cache states are inside it.
Decomposing it client-side
Browsers hand you the split for free. The Resource Timing interface timestamps every phase — domainLookupStart/End, connectStart/End, secureConnectionStart, requestStart, responseStart — so DNS, connect, TLS and the wait-for-response are separately measurable in RUM and visible per-request in DevTools. The wait segment (requestStart to responseStart) is the only part your edge and origin participate in; everything before it is network setup, owned by protocol configuration and resolver behaviour, and improved by TLS tuning and connection reuse rather than by anything at your origin. Segment your field data this way and a class of arguments evaporates: "TTFB is bad in Australia" frequently decomposes into "setup is bad in Australia", which is a routing and resumption conversation, not an application one.
The cache-status split
The single highest-value cut: separate TTFB by cache result. A hit's wait segment is edge processing only — it should be small and stable, and if it isn't, the problem is at the edge and no amount of origin optimization will touch it. A miss's wait segment contains the origin round trip and your application time, so it tells you what un-cached users experience and what every user would experience without the CDN. Reporting the blend is how sites fool themselves: raise the hit ratio and blended TTFB improves with zero change to either underlying number. Get cache status into your measurements — synthetics can read the response header per run; for field data, a response header exposed to JavaScript or logged server-timing values does the job.
Attributing origin time with edge logs
For the miss path, the edge log is the arbiter, because the edge sees both sides: when the request arrived and how long the origin fetch took. Most platforms can log an origin-fetch duration or upstream time alongside total request time (field names vary — the log-line guide maps them). With that field, attribution is arithmetic: origin fetch time is the origin team's number; total minus origin fetch is the edge's overhead; the client-measured wait minus the edge total is the client-to-edge network. A useful refinement is the Server-Timing response header: have origin and edge each stamp their durations onto the response, and every layer's cost rides along into DevTools and RUM where anyone can read it without log access.
Setting targets that mean something
One TTFB target for all traffic is meaningless; set them per segment. Edge hits should be fast and boringly consistent everywhere — this is what you pay a CDN for, and regressions here are provider conversations. Miss-path targets belong to the origin team, measured at the edge log, with the network segment excluded so nobody is accountable for physics. Setup segments get budgets per geography, because a Sydney user's floor is not a Frankfurt user's floor. Track p75 and p90, not averages — setup costs are bimodal (resumed vs cold, reused vs new) and an average of two populations describes neither. And when a target is breached, the decomposition tells you whom to page — which, run through the triage flowchart, turns a vague "site feels slow" into a ticket with an owner attached.