
Edge logs are the only complete record of what your CDN actually did — every dashboard is a summary of them. Collected well they answer billing disputes, security incidents and performance regressions; collected badly they are a storage bill. This is the field list, the retention plan, and the first three reports.
The fields that earn their bytes
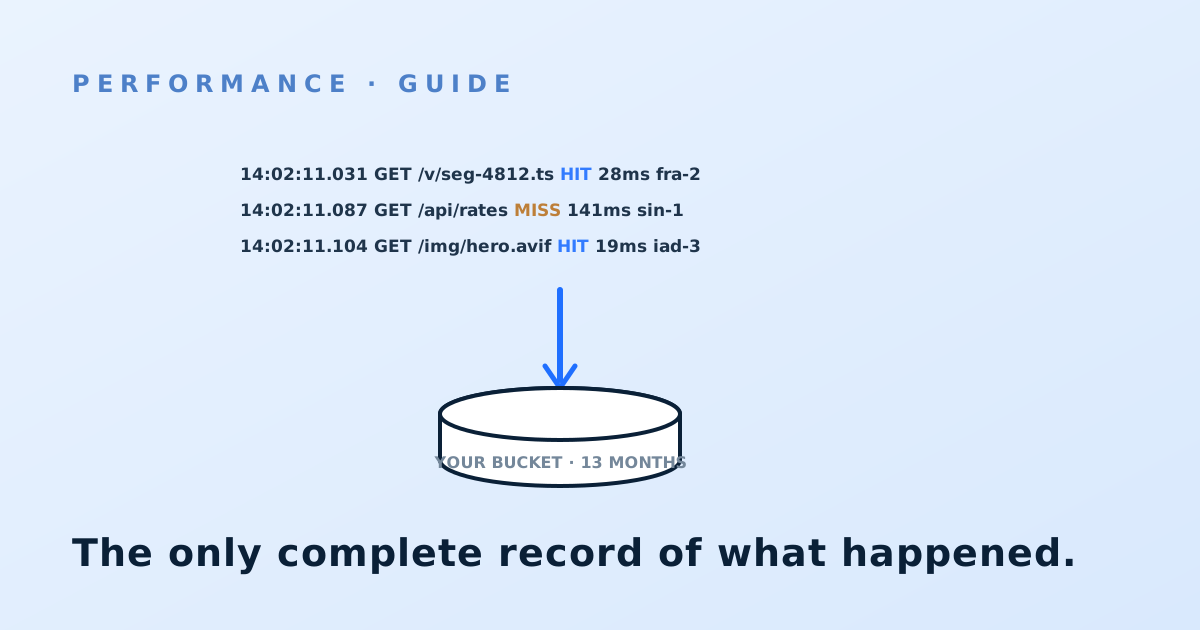
Per request, keep: timestamp with milliseconds, client IP (or a privacy-safe truncation — decide deliberately), request host and path, status code, response bytes, cache status (HIT/MISS/PASS/EXPIRED), TTFB at the edge, POP or region identifier, TLS version, user agent, and referrer. Two fields people skip and later need: the origin response time on misses (separates slow-CDN from slow-origin in one column) and the request ID (joins an edge line to an origin line during an incident).
Skip full headers and bodies by default; they multiply volume 5–10× and are almost never what an investigation needs.
Retention in tiers, not one number
Ninety days hot for operational queries; 13 months cold for billing-cycle comparisons and security lookback; longer only if compliance says so. The cost shape: compressed edge logs run roughly 0.2–0.5 GB per million requests, and cold object storage prices that in cents — a site doing a billion requests a month stores a year of logs for tens of dollars. The expensive part is never storage; it is querying, so partition files by date and host as they land.
Delivery: push to storage you control
Every major provider will push logs to your object storage bucket in near-real-time or batches; take it, even if you also like their dashboard. Provider-side retention is 7–30 days and vanishes with the contract — which is precisely when you need history, because renewal disputes and post-migration comparisons both reach backwards. Real-time streaming delivery matters for live-event operations; for everyone else, 5-minute batches are fine and cheaper.
The first three reports
Build these before anything fancy. Billing reconciliation: sum response bytes per month per host and stand it next to the invoice; a persistent gap over ~5% is a measurement-definition conversation with the vendor, in writing. Hit-ratio by content group: cache status counts split by path prefix, which finds the one route ruining an otherwise healthy ratio. And p95 TTFB by region by day, which turns “the site feels slow in Australia” from a ticket into a chart. Each is one query over the fields above — which is the argument for the fields above.